안녕하세요 쿤드입니다. 🍀


엔지니어로 밥먹어 먹고 살고 있는데

TCP를 제대로 아는것이 없어서 하나씩 이해해보려고 하는중에 있습니다.

실제로 사용하는것의 값은 없애고 factor중에서 변화폭이 컸던 것들 위주로 간추려서 정리를 해보겠습니다.


물론 네트웍 트래픽만 봐도 장애라는것을 인지할 수는 있습니다.

평소 장애


TCP 통계 지표를 24개만 모아서 보고 있는데 (1분마다 이전과 현재의 증가한 차이 값을 수집해서 추이를 봄)

그중에 10개만 추려보았고 

그 중에서 다시 추려보니 ActiveOpens, PassiveOpens 추이만 봐도 장애 예측은 가능하겠네요..


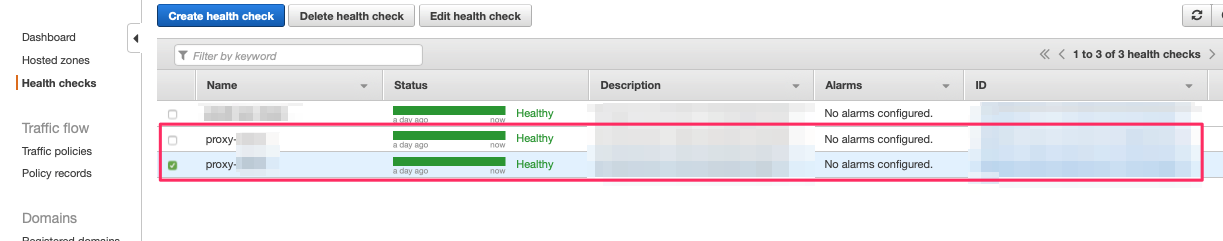
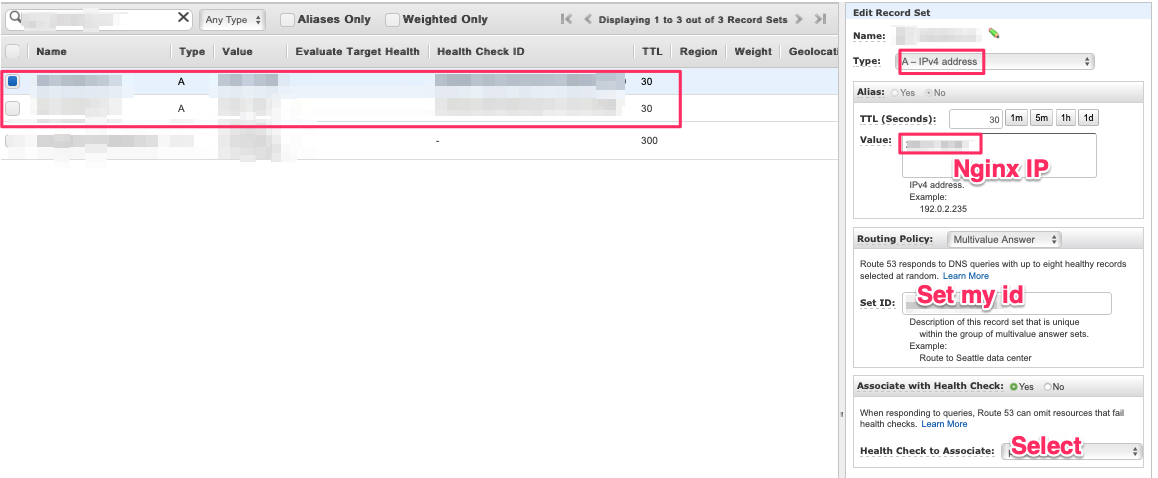
당시 앞단에 있던 nginx에서 발생했던 error log (에러 해결 관련 nginx 설정 링크

upstream sent invalid chunked response while reading upstream, 


빨간선: ActiveOpens

파란선: PassiveOpens

평소 장애

큰 폭으로 감소했던 지표들을 요약하면

  • Nginx error 발생으로 신규 TCP 연결이 급격하게 감소 (나머지 지표는 그에 따른 영향으로 감소)

아... 그간 이 지표의 의미 해석을 미루고 미루고 미뤘는데 결과가 이렇게 허무하다니..

유입 고객이 늘어나서 터져나가는 장애를 겪어야 할텐데.. 코로나는 언제 지나가려나... 코로나가 간다고 손님이 늘긴하려나...
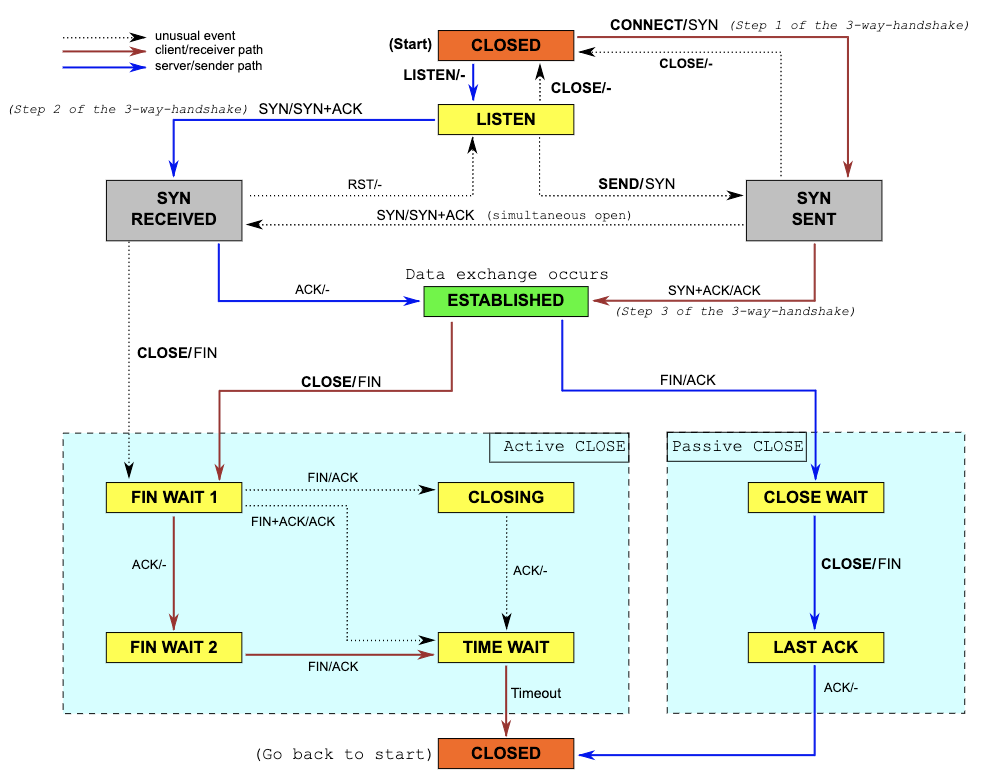


ActiveOpens

- TCP Client/Receiver (SYN을 보내고 SYN-SENT 상태가 된)


PassiveOpens

- TCP Server/Sender (SYN 받고 SYN-ACK 보내고 SYN-RCVD 상태가 된)


AttemptFails 

- TCP 연결이 SYN-SENT 상태 또는 SYN-RCVD 상태에서 CLOSED 상태로 곧 바로 전환된 횟수

- TCP 연결이 SYN-RCVD에서 LISTEN 상태로 바로 전환한 횟수


RetransSegs

- 재전송된 총 세그먼트 수(이전에 전송했던 하나 이상의 TCP 세그먼트를 포함하여 전송한 TCP 세그먼트 수)


반응형

'기타' 카테고리의 다른 글

테넌트  (656) 2020.07.23
TCP Status 상태에 대해서  (433) 2020.07.15
TCP 통계  (145) 2020.07.14
Kerberos Setup (KR)  (964) 2019.08.22
500 Error on Confluence Startup (KR)  (333) 2019.07.29

안녕하세요 쿤드입니다. 🍀

netstat --statistics 명령부터 시작해보겠습니다. (nstat 명령이 훨씬 간결하긴하지만..)

처음에는 각각의 인자들이 무엇을 의미하는지 확인하려고 했으나
이 페이지를 작성하다보니 하나씩 찾다보니 의미만 아는것은 별 필요가 없는것 같았습니다.


장애 당시를 기준으로 확인하는것이 좋을것 같아서 그때 확인한 factor들에 대해서

아래에 따로 정리해두었습니다.

작년에 제가 다니던 회사에서 중간에서 gateway역할을 해주는 application의 오류로 장애가 3시간정도 발생한적이 있었는데

그 당시 tcp 통계 변화를 바탕으로

내부적인 application 장애가 발생해서 외부에서 유입되는 traffic 처리를 못한 경우 어떤 차이가 발생하는지를 확인 해보도록 하겠습니다.


아래에 있는 내용들은 netstat으로 확인한 통계 값인데 

무엇을 의미하는건지 모르면 여기에 각각 설명이 잘 나와있습니다.

혹은 Linux Document


Ip:
    15829871449 total packets received (InReceives)
    0 forwarded (ForwDatagrams)
    0 incoming packets discarded (InDiscards)
    15829871405 incoming packets delivered (InDelivers)
    14182698760 requests sent out (OutRequests)
    31 outgoing packets dropped
    16 dropped because of missing route (OutNoRoutes)
    143 fragments failed
Icmp:
    12710040 ICMP messages received (InMsgs)
    167 input ICMP message failed. (InErrors)
    ICMP input histogram: 
        destination unreachable: 12263649 (InDestUnreachs)
        timeout in transit: 420248 (InTimeExcds)
        source quenches: 6 (InSrcQuenchs)
        redirects: 92 (InRedirects)
        echo requests: 26045 (InEchos)
    28937 ICMP messages sent
    0 ICMP messages failed
    ICMP output histogram:
        destination unreachable: 2892 (OutDestUnreachs)
        echo replies: 26045 (OutEchoReps)
IcmpMsg:
        InType3: 12263649
        InType4: 6
        InType5: 92
        InType8: 26045
        InType11: 420248
        OutType0: 26045
        OutType3: 2892
Tcp:
    25768376 active connections openings (TcpActiveOpens)
    647707490 passive connection openings (TcpPassiveOpens)   
    4647341 failed connection attempts (AttemptFails)
    31117340 connection resets received (EstabResets)
    3537 connections established (CurrEstab) https://tools.ietf.org/html/rfc793   
    15817063195 segments received (InSegs)
    16491280655 segments send out (OutSegs)
    986318177 segments retransmited (RetransSegs)
    7440 bad segments received. (InErrs)
    91126171 resets sent (OutRsts)
Udp:
    95601 packets received (InDatagrams)
    2569 packets to unknown port received. (NoPorts)
    0 packet receive errors (InErrors)
    111544 packets sent (OutDatagrams)
    0 receive buffer errors (RcvbufErrors)
    0 send buffer errors (SndbufErrors)
UdpLite:
TcpExt:
    42045 SYN cookies sent (SyncookiesSent)
    12143 SYN cookies received (SyncookiesRecv)
    60209039 invalid SYN cookies received (SyncookiesFailed)
    4647134 resets received for embryonic SYN_RECV sockets (EmbryonicRsts)
    3821 packets pruned from receive queue because of socket buffer overrun (PruneCalled)
    63491 ICMP packets dropped because they were out-of-window (OutOfWindowIcmps)
    22286 ICMP packets dropped because socket was locked (LockDroppedIcmps)
    107834482 TCP sockets finished time wait in fast timer (TW)
    46352300 packets rejects in established connections because of timestamp (PAWSEstab)
    607439027 delayed acks sent (DelayedACKs)
    632566 delayed acks further delayed because of locked socket (DelayedACKLocked)
    Quick ack mode was activated 199302465 times (DelayedACKLost)
    208055 SYNs to LISTEN sockets dropped (ListenDrops)
    418093 packets directly queued to recvmsg prequeue. (TCPPrequeued)
    122606 bytes directly in process context from backlog (TCPDirectCopyFromBacklog)
    79146389 bytes directly received in process context from prequeue (TCPDirectCopyFromPrequeue)
    1574327100 packet headers predicted (TCPHPHits)
    402495 packets header predicted and directly queued to user (TCPHPHitsToUser)
    7766206385 acknowledgments not containing data payload received (TCPPureAcks)
    559462251 predicted acknowledgments
    24017 times recovered from packet loss due to fast retransmit
    72915270 times recovered from packet loss by selective acknowledgements
    586 bad SACK blocks received
    Detected reordering 889310 times using FACK
    Detected reordering 465211 times using SACK
    Detected reordering 697 times using reno fast retransmit
    Detected reordering 13789060 times using time stamp
    6344097 congestion windows fully recovered without slow start
    10638781 congestion windows partially recovered using Hoe heuristic
    1716234 congestion windows recovered without slow start by DSACK
    43272810 congestion windows recovered without slow start after partial ack
    TCPLostRetransmit: 1784385
    13185 timeouts after reno fast retransmit
    15322792 timeouts after SACK recovery
    26945066 timeouts in loss state
    104358514 fast retransmits
    30761536 forward retransmits
    72817949 retransmits in slow start
    189678472 other TCP timeouts
    TCPLossProbes: 324536377
    TCPLossProbeRecovery: 76481412
    12218 classic Reno fast retransmits failed
    27270545 SACK retransmits failed
    200116946 DSACKs sent for old packets (TCPDSACKOldSent)
    3581427 DSACKs sent for out of order packets 
    188637563 DSACKs received
    1897085 DSACKs for out of order packets received
    17269734 connections reset due to unexpected data (TCPAbortOnData)
    994645 connections reset due to early user close (TCPAbortOnClose)
    71206457 connections aborted due to timeout (TCPAbortOnTimeout)
    20 times unable to send RST due to no memory
    TCPSACKDiscard: 2614 (Number of SACK blocks are invalid)
    TCPDSACKIgnoredOld: 457719 (Number of DSACK block is invalid, undo_marker not set)
    TCPDSACKIgnoredNoUndo: 94644730 (Number of DSACK block is invalid, undo_marker set)
    TCPSpuriousRTOs: 3443956 (Number of The spurious retransmission timeout detected by the `F-RTO`_ algorithm)
    * skb: The linux networking stack stores data in sk_buff struct
    TCPSackShifted: 17209501 (Number of skb is shifted)
    TCPSackMerged: 57304616 (Number of skb is merged)
    TCPSackShiftFallback: 234570612 (Number of TCP stack doesn't merge it for some reasons.)
    TCPBacklogDrop: 43
    IPReversePathFilter: 3
    TCPReqQFullDoCookies: 42045
    TCPRetransFail: 271
    TCPRcvCoalesce: 606120335
    * OFO: Out Of Order
    TCPOFOQueue: 154893248 (Number of packets queued in OFO queue)
    TCPOFOMerge: 3581444 (Number of packets in OFO that were merged with other packets)
    TCPChallengeACK: 2105995
    TCPSYNChallenge: 64987
    TCPFastOpenCookieReqd: 3824
    TCPSpuriousRtxHostQueues: 332
    TCPAutoCorking: 19132
    TCPWantZeroWindowAdv: 6989
    TCPSynRetrans: 106752693 (Number of SYN and SYN/ACK retransmits to break down retransmissions into SYN,
                                                  fast-retransmits, timeout retransmits, etc.  참고링크)

    TCPOrigDataSent: 11168295644 (Number of outgoing packets with original data, 참고링크)
    TCPHystartTrainDetect: 97852 (Number of  the ACK train length threshold is detected)
    * CWND: Congestion Window
    TCPHystartTrainCwnd: 2647949 (The sum of CWND detected by ACK train length)
    TCPHystartDelayDetect: 21988563 (Number of the packet delay threshold is detected)
    TCPHystartDelayCwnd: 781061970 (The sum of CWND detected by packet delay)
    TCPACKSkippedSynRecv: 1717067 (If the ACk sending frequency is higher than tcp_invalid_ratelimit allows, then +1)
    * PAWS: Protect Against Wrapped Sequence numbers
    TCPACKSkippedPAWS: 1738488
    TCPACKSkippedSeq: 38312
    TCPACKSkippedFinWait2: 2294
    TCPACKSkippedTimeWait: 230801
    TCPACKSkippedChallenge: 8756
IpExt:
    InNoRoutes: 41
    InOctets: 8387403650946
    OutOctets: 12141527324794
    InNoECTPkts: 14298811581
    InECT1Pkts: 279253858
    InECT0Pkts: 271928848
    InCEPkts: 981945413


그런데 그 설명을 번역만 하는것으로는 도무지 뜬구름 잡는 얘기 같아서 하나도 이해가 가지 않습니다.

일단은 이 수치가 무엇을 의미하는지 먼저 알아보고

이 중에서 필요한것만 따로 모아서 다시 보아야 겠습니다.


TCP 통계는 TCP state diagram과 같이 봅니다.


TCP 통계를 카테고리화해서 묶어서 보면 한눈에 들어와서 tcp 통계 항목들이 좀 보입니다.
https://perthcharles.github.io/2015/11/10/wiki-netstat-proc/

그마나 찾긴했으나 제가 사용하는 OS와 다른지 통계 factor에 차이가 있습니다.

적당히 느낌만 가지고 넘어갑니다.

category Involve Counters
Realtime RtoAlgorithm、RtoMin、RtoMax、MaxConn
Connection ActiveOpens、PassiveOpens、AttemptFails、CurrEstab、EstabResets
Packet InSegs、OutSegs、RetransSegs、InErrs、OutRsts、InCsumErrors、EmbryonicRsts
syncookies SyncookiesSent、SyncookiesRecv、SyncookiesFailed
TIME_WAIT recycle TW、TWRecycled、TWKilled、TCPTimeWaitOverflow
RTO frequency TCPTimeouts、TCPSpuriousRTOs、TCPLossProbes、TCPLossProbeRecovery、
TCPRenoRecoveryFail、TCPSackRecoveryFail、
TCPRenoFailures、TCPSackFailures、
TCPLossFailures
Retrans Quantity TCPFastRetrans、TCPForwardRetrans、
TCPSlowStartRetrans、TCPLostRetransmit、
TCPRetransFail
FastOpen TCPFastOpenActive、TCPFastOpenPassive、
TCPFastOpenPassiveFail、TCPFastOpenListenOverflow、
TCPFastOpenCookieReqd
MD5 TCPMD5NotFound、TCPMD5Unexpected
DelayedACK DelayedACKs、DelayedACKLocked、DelayedACKLost、
TCPSchedulerFailed
DSACK TCPDSACKOldSent、TCPDSACKOfoSent、
TCPDSACKRecv、TCPDSACKOfoRecv、
TCPDSACKIgnoredOld、TCPDSACKIgnoredNoUndo
Reorder TCPFACKReorder、TCPSACKReorder、
TCPRenoReorder、TCPTSReorder
Recovery TCPRenoRecovery、TCPSackRecovery、
TCPRenoRecoveryFail、TCPSackRecoveryFail
Abort TCPAbortOnData、TCPAbortOnClose、
TCPAbortOnMemory、TCPAbortOnTimeout、
TCPAbortOnLingerTCPAbortFailed


반응형

'기타' 카테고리의 다른 글

TCP Status 상태에 대해서  (433) 2020.07.15
TCP 통계수치 변화 (장애 상황)  (1029) 2020.07.15
Kerberos Setup (KR)  (964) 2019.08.22
500 Error on Confluence Startup (KR)  (333) 2019.07.29
squid proxy  (4) 2018.12.19

안녕하세요 쿤드입니다. 🍀

S3 버킷에서 어떤 object가 생성되면 그에 대한 이벤트를 SQS로 받아서 처리할 필요가 생겼습니다.

설정대로 맞춰놓고 생성을 했는데 

  • [버킷] - [Properties] - Advenced settings [Events] 

에러가 발생합니다.

S3 이벤트 세팅

에러메시지

Unable to validate the following destination configurations. Permissions on the destination queue do not allow S3 to publish notifications from this bucket. (arn:aws:sqs:REGION:AWS계정ID:세팅하려던_SQS_QUEUE_NAME)


최초 생성은 IAM role로 접근에 제한을 둔 account로 생성하다가 실패해서 단순히 account에 권한이 없어서 안되는줄 알았습니다.

그래서 ADMIN 권한 (* 접근)을 가진 account로 다시 생성을 했는데 

마찬가지로 에러가 발생합니다.


이제서야 AWS 문서를 찾아서 읽어봤습니다.

https://docs.aws.amazon.com/AmazonS3/latest/dev/ways-to-add-notification-config-to-bucket.html 


Walkthrough: Configure a bucket for notifications (SNS topic and SQS queue) - Amazon Simple Storage Service

Walkthrough: Configure a bucket for notifications (SNS topic and SQS queue) Walkthrough summary In this example, you add a notification configuration on a bucket requesting Amazon S3 to do the following: Publish events of the s3:ObjectCreated:* type to an

docs.aws.amazon.com

읽어보니

SNS를 추가하면 SNS topic에 권한을 설정해주고

SQS를 추가하는 거라면 마찬가지로 SQS Queue에 권한을 추가하라는 말이었습니다.


남은 작업은

이제 정확하게 권한을 추가해주면 되는데 

{
 "Version": "2012-10-17",
 "Id": "example-ID",
 "Statement": [
  {
   "Sid": "example-statement-ID",
   "Effect": "Allow",
   "Principal": {
    "AWS":"*"  
   },
   "Action": [
    "SQS:SendMessage"
   ],
   "Resource": "SQS-queue-ARN",
   "Condition": {
      "ArnLike": { "aws:SourceArn": "arn:aws:s3:*:*:bucket-name" },
      "StringEquals": { "aws:SourceAccount": "bucket-owner-account-id" }
   }
  }
 ]
}

이게 뭐지? (라고 처음엔 느껴졌지만 작업을 마무리하고 다시 읽어보니 이해가 갑니다.)


일단 stackoverflow에서 비슷한 문제를 찾았습니다.

 stackoverflow.com/q/54791704/8163714


Unable to configure SQS queue notification in S3

I created an SQS queue and added policy under permission tab allowing only my account users to configure the configure the notification Policy Document { "Version": "2012-10-17", "Id": "arn:...

stackoverflow.com

들여쓰기의 차이일 뿐인데 이것을 보니 이해가 갑니다.

https://gist.github.com/marcelog/7b0224b63c90802996ab2dee7d7082e4


SQS Policy to allow an S3 bucket to publish messages

SQS Policy to allow an S3 bucket to publish messages - aws-sqs.policy

gist.github.com

이 설정은 SQS에서 QUEUE를 선택하고 

아래 화면에서 볼 수 있었습니다.

여기에 위의 gist에 있는 내용에서 나와 관련된 내용을 추가하고

S3에서 접근할테니 관련 bucket 정보를 추가하면 됩니다.


Bucket이 1개만 추가되지 않을 수도 있는데 2개 이상 추가도 됩니다. 

2개의 bucket을 [   ] 배열로 묶으면 더 보기 좋을텐데 방법을 못 찾았습니다.

Principals는 Everybody(*)로 두었는데, 

account로 제한을 더 두는게 나을 것 같은데 방법을 못 찾겠다. 제한을 좀 더 두고 싶은데..

  • arn:aws:iam::계정의ID:root 로만 되는것 같고 *을 줄 수가 없다. 내가 못 찾은걸지도 모르겠지만... 


S3에서 event 생성 잘 됩니다.


반응형

'Infra' 카테고리의 다른 글

AWS EKS Service Role 생성 (IAM)  (454) 2020.07.23
AWS EKS Cluster 세팅  (159) 2020.07.23
AWS의 Cloudwatch와 CloudTrail의 차이  (14) 2020.06.01
Route53 DNS health check (for Nginx)  (8) 2019.12.20
Setting Logstash amazon_es output  (648) 2019.11.04

안녕하세요 쿤드입니다. 🍀

CloudWatch 요금 폭탄이 나와서 추적하는데 CloudWatch/CloudTrail의 차이를 안다고 생각했는데
말로 설명하려니 말문이 막혀서 찾게 되었습니다.


원작자 허락하에 포스팅

원문: https://medium.com/awesome-cloud/aws-difference-between-cloudwatch-and-cloudtrail-16a486f8bc95


CloudWatch vs CloudTrail in AWS

CloudWatch

AWS CloudWatch
CloudWatch는 AWS 서비스 및 자원 활동에 초점을 맞추고, 그 상태와 성능에 대해 보고(report)
CloudTrail은 AWS 환경에서 수행 된 모든 작업의 로그

CloudWatch:

AWS CloudWatch는 AWS 클라우드 리소스와 AWS에서 실행되는 애플리케이션의 모니터링 서비스입니다. 

Amazon CloudWatch를 사용하여 메트릭 수집 및 추적 로그 파일의 수집 및 모니터링, 알람 설정, AWS 리소스 사용량 변화에 자동으로 대응 할 수 있습니다.

CloudTrail:

AWS CloudTrail은 AWS 계정 거버넌스, 컴플라이언스, 운영 감사, 리스크 감사를 가능하게하는 서비스입니다. 

CloudTrail을 사용하면 AWS 인프라 작업 관련 계정 활동을 기록하고 지속적으로 모니터링 및 유지할 수 있습니다. 

CloudTrail은 AWS 관리 콘솔, AWS SDK command line 도구, 기타 AWS 서비스로 실행 된 것을 포함한 AWS 계정 활동 이벤트 기록을 제공합니다. 이 이벤트 기록으로 보안 분석, 자원 변경 추적, 문제 해결이 간소화됩니다.


Comparison between CloudWatch and CloudTrail

CloudTrail


CloudWatch : "AWS에서 무슨 일이 일어나고 있나?"특정 서비스 또는 응용 프로그램의 모든 이벤트를 기록합니다.

What is happening on AWS?
CloudTrail : "AWS에서 누가 무엇을합니까?"서비스 또는 리소스에 대한 API 호출.

Who did what on AWS?


CloudWatch는 AWS 리소스와 애플리케이션의 모니터링 서비스입니다. 

CloudTrail은 AWS 계정의 API 활동을 기록하는 웹 서비스입니다. 모두 AWS의 편리한 모니터링 도구입니다.


CloudWatch는 기본적으로 EC2 인스턴스, EBS 볼륨, RDS DB 인스턴스와 같은 자원의 무료 기본 모니터링을 제공합니다. 

AWS 계정을 만들면 CloudTrail도 기본적으로 활성화됩니다.
CloudWatch를 사용하면 메트릭 수집 및 추적 로그 파일을 수집하고 모니터링 및 알람 설정을 할 수 있습니다. 


한편, CloudTrail는 요청을 한 사용자, 사용 된 서비스 실행 된 액션, 매개 변수 및 AWS 서비스에서 반환 된 응답 요소에 대한 정보를 기록합니다. 

CloudTrail 로그는 지정된 S3 버킷 또는 CloudWatch Logs 로그 그룹에 저장됩니다.

일반적으로 CloudTrail은 API 호출에서 15 분 이내에 이벤트를 전달합니다. 


CloudWatch는 기본적인 모니터링은 5 분 간격으로, 자세한 모니터링은 1 분 간격으로 메트릭 데이터를 제공합니다. 

CloudWatch Logs 에이전트는 기본적으로 5 초마다 로그 데이터를 전송합니다.
AWS 리소스의 상세한 모니터링을 사용하여 추가 비용으로 더 자주 메트릭 데이터를 CloudWatch에 전송할 수 있습니다.

CloudTrail은 규정 준수 및 규제 기준의 확보에 도움이됩니다.

CloudWatch Logs는 응용 프로그램 로그에 대한 보고서를 제공하고 

CloudTrail Logs는 AWS 계정에서 발생한 것에 대한 특정 정보를 제공합니다.


CloudWatch 이벤트는 AWS 리소스에 대한 변경을 기술 시스템 이벤트의 실시간 스트림입니다. 

CloudTrail은 AWS 계정의 AWS API 호출에 중점을두고 있습니다.
CloudTrail은 AWS 리전마다 관리 이벤트 로그의 무료 복사본을 하나 전달합니다. 관리 이벤트는 사용자가 계정에 로그인 할 때 등 AWS 계정의 리소스로 실행 된 관리 작업이 포함됩니다. 로깅 데이터 이벤트는 부과됩니다. 데이터 이벤트는 S3 객체 수준의 API 활동과 Lambda 함수 실행 활동 등 자원 자체에서 또는 리소스에서 실행되는 리소스 작업이 포함됩니다.


반응형

'Infra' 카테고리의 다른 글

AWS EKS Cluster 세팅  (159) 2020.07.23
S3에 SQS notification event 추가할때 권한 설정  (86) 2020.06.26
Route53 DNS health check (for Nginx)  (8) 2019.12.20
Setting Logstash amazon_es output  (648) 2019.11.04
EC2 instance prevent termination (KR)  (309) 2019.07.26

Hello, I'm Kundu 🍀


https://docs.aws.amazon.com/Route53/latest/DeveloperGuide/dns-failover.html


https://docs.aws.amazon.com/Route53/latest/DeveloperGuide/dns-failover.html

Creating Amazon Route 53 Health Checks and Configuring DNS Failover

docs.aws.amazon.com

Goal

- Customer incoming through Nginx(NOT Nginx Plus), and Nginx doesn't support failover like ha-proxy. 

   I'd like to use dns-failover for stable service.


Setup


[Route53] - [Health checks] 

  1. Set your Name 
  2. Select what to monitor, I select Endpoint
  3. Endpoint setup
    1. Public IP address for each Nginx
    2. Host name (I add this '/etc/nginx/conf.d/443_health.conf' --> server_name health.mydomain.com)
    3. HTTPS (443)
    4. Path for Nginx (in my case: /etc/nginx/html/status/health.html) 
    5. set health.html  ( $ echo "alive" > health.html )
  4. Set String matching 'Yes'
  5. Search string 'alive', I already set 'STEP 3-5'
  6. Set Health checker regions


Now I have 2 Health checks


[Route53] - [Hosted zones]

Add 2 Record Sets

Edit Record Set each.

  • Routing Policy is up to you. (Multiplevalue Answer, 
  • Health Check to Associate must same IP address (Alias Values)


반응형

Kerberos user management sample flask code.

You could re-use this code for Kerberos host management as well


@app.route('/krb/user/<username>', methods=['GET', 'DELETE', 'POST', 'PUT'])
def userAPI(username):
    result_code = "success"
    result_message = "ok"

    if request.method == 'GET':
        cmd = "/usr/bin/kadmin -p account/admin -w ADminP@ssW0rd -q \"getprinc " + username + "\""
    elif request.method == 'POST':
        cmd = "/usr/bin/kadmin -p account/admin -w ADminP@ssW0rd -q \"addprinc -policy bhero -pw " + username + "123!@# " + username + "\""
    elif request.method == 'DELETE':
        cmd = "/usr/bin/kadmin -p account/admin -w ADminP@ssW0rd -q \"delprinc -force " + username + "\""
    elif request.method == 'PUT':
        password = username + "*()890"
        cmd = "/usr/bin/kadmin -p account/admin -w ADminP@ssW0rd -q \"cpw -pw " + password + " " + username + "\""

    try:
        cmd_result = subprocess.Popen(cmd, shell=True, stdout=subprocess.PIPE, stderr=subprocess.STDOUT)
        message = cmd_result.stdout.read()

        fd = open(logfile, 'a')
        fd.write(str(datetime.now()) + " cmd : " + cmd + " result : " + message + " \n")

        if message.find("already exists") != -1:
            result_code = "failed"
            result_message = username + " is already exists"
        elif message.find("does not exist") != -1:
            result_code = "failed"
            result_message = username + " is not exist"
        elif request.method == 'PUT':
            if message.find("changed.") == -1:
                result_code = "failed"
                result_message = message
        elif request.method == 'GET':
            auth_time = "[never]"
            message = re.sub("Last successful authentication: .*", "Last successful authentication: " + auth_time, message)
            result_message = message
        fd.close()
    except subprocess.CalledProcessError as e:
        result_code = "failed"
        result_message = e.returncode

    message = {'result': result_code, 'message': result_message}
    fd.close()

    return json.dumps(message)


@app.route('/krb/user', methods=['GET'])
def showAllUsers():
    result_code = "success"
    result_message = "ok"

    if request.method == 'GET':
        cmd = "/usr/bin/kadmin -p account/admin -w ADminP@ssW0rd -q \"getprincs\" | grep -v \"\/\""

    try:
        cmd_result = subprocess.Popen(cmd, shell=True, stdout=subprocess.PIPE, stderr=subprocess.STDOUT)
        result_message = cmd_result.stdout.read()

    except subprocess.CalledProcessError as e:
        result_code = "failed"
        result_message = e.returncode

    message = {'result': result_code, 'message': result_message}

    return json.dumps(message)
반응형

'Setup' 카테고리의 다른 글

Kerberos setup - 3 (MacOS User)  (481) 2019.12.09
Kerberos setup - 2 (Kerberos Client)  (639) 2019.12.09
Kerberos setup - 1 (Kerberos Server)  (1459) 2019.12.09
OpenVPN setup - 3 (OpenVPN Client for VPC Tunnel)  (995) 2019.12.09
OpenVPN setup - 2 (OpenVPN Server)  (964) 2019.12.09

macOS User Configuration


1. /etc/krb5.conf 

[libdefaults]
default_realm = ABCDEF.COM
allow_weak_crypto = false
rdns = false

[realms]
ABCDEF.COM = {
kdc = kdc.abcdef.com
kdc = kdc2.abcdef.com
admin_server = kdc.abcdef.com
kpasswd_server = kdc.abcdef.com
}


2.  /etc/ssh/ssh_config

  • After MacOS update, this configuration usually reset. So after update you must check this configuration.
GSSAPIAuthentication yes    => Allow authentication protocol for ssh kerberos support
StrictHostKeyChecking no     


3. kinit at the MacOS terminal

kinit --kdc-hostname=kdc.abcdef.com,kdc2.abcdef.com sfixer@ABCDEF.COM


반응형

Install

yum --disablerepo=*  --enablerepo=base,update install -y dmidecode krb5-libs


Configuration

1. Set files if you need

  • /etc/hosts
  • /etc/ssh/sshd_config

2. Run ntp update

ntpdate -u pool.ntp.org

3. Registration for principal with kadmin account at the new kerberos server. And create keytab

# addpric
/usr/bin/kadmin -p account/admin -w RkaWkrdldi -q "addprinc -randkey host/dev1-api-all.abcdef.com"

# ktadd
/usr/bin/kadmin -p account/admin -w RkaWkrdldi -q ktadd -k "/home/ec2-user/seeds/keytabs/dev1-api-all.abcdef.com host/dev1-api-all.abcdef.com"

# chmod
chmod og+r /home/ec2-user/seeds/keytabs/dev1-api-all.abcdef.com

4. Add kdc hosts

cat /home/ec2-user/seeds/hosts

10.100.56.52      dev1-api-lucky21.abcdef.com       dev1-api-lucky21              
10.100.56.51      dev1-api-lucky11.abcdef.com       dev1-api-lucky11              
10.100.56.50      dev1-api-lucky01.abcdef.com       dev1-api-lucky01              
10.100.56.21      dev1-api-point11.abcdef.com     dev1-api-point11                
10.100.56.22      dev1-api-point12.abcdef.com     dev1-api-point12                 
10.100.56.20      dev1-api-point01.abcdef.com     dev1-api-point01                
10.100.56.23      dev1-api-point21.abcdef.com     dev1-api-point21                
10.100.56.24      dev1-api-point22.abcdef.com     dev1-api-point22                 
10.100.0.162      dev1-proxy-out21.abcdef.com        dev1-proxy-out21             
10.100.0.161      dev1-proxy-out11.abcdef.com        dev1-proxy-out11    

5. Copy keytab(Step. 3) file to kerberos client

/etc/krb5.keytab


Setup api server for this setting

Launce ec2 & setup nginx + gunicorn + flask 

When setup kerberos client

Just run command

  • curl -s krb5-client.abcdef.com/seeds/krb-svr-config | /bin/bash
반응형

+ Recent posts